
Why Scientists Are Turning to Artists to Understand Big Data
Written by Gabby Coleman
Edited by Tanishka Jape
Modern science is not suffering from a lack of information. It’s overwhelmed by it. Space missions, climate models, artificial intelligence systems, and large-scale computational simulations all generate enormous, multidimensional datasets. As complexity grows, interpreting data becomes more difficult than collecting it. Increasingly, scientists are turning to artists to help make sense of information that exceeds traditional modes of visualization.
As datasets grow in size and intricacy, static charts and graphs may not fully capture patterns, relationships, or underlying structures. What becomes ‘unseeable’ is not invisible data, but a pattern buried deep within millions of variables and algorithmic processes that cannot be grasped through spreadsheets alone. Institutions like NASA have recognized that artists can contribute alternative ways of seeing and interpreting scientific information [1]. Through its Open Science initiatives, NASA integrates artists into data-centered environments, placing them inside research teams where they work directly with scientists and engineers [1]. Rather than simply illustrating results, artists engage with raw datasets, experiment with visual structures, and reorganize complex information into perceptible forms.
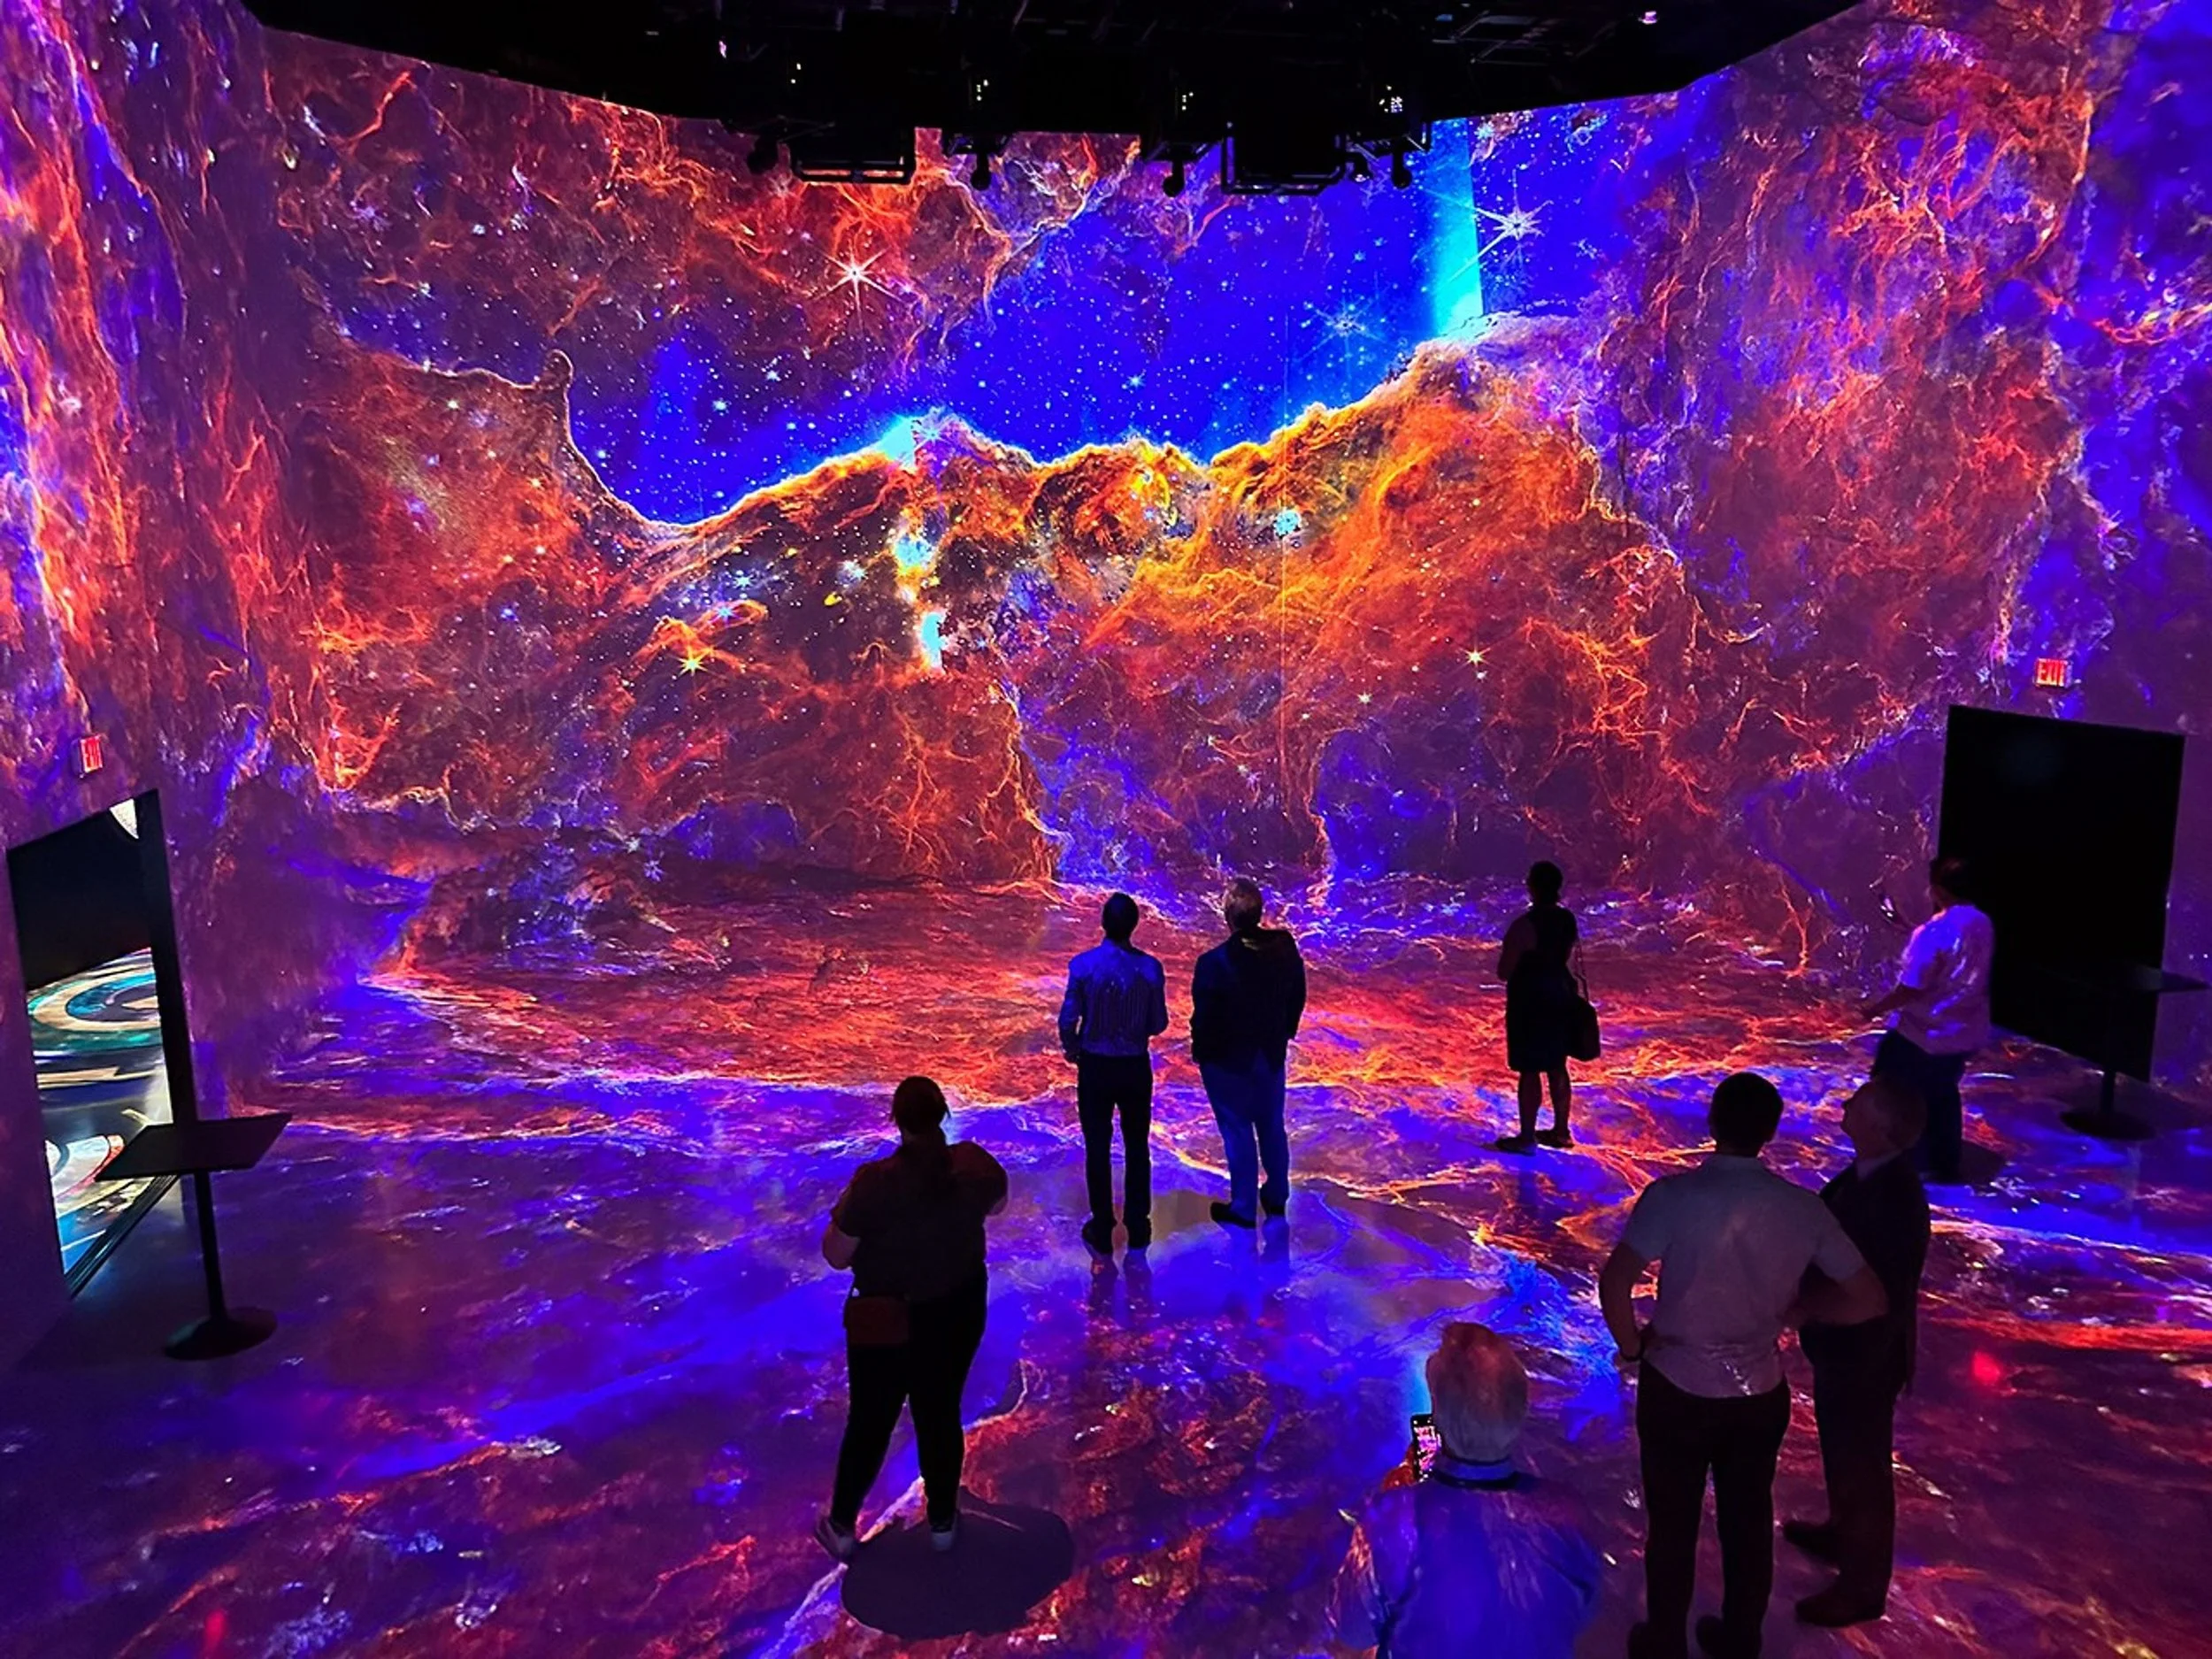
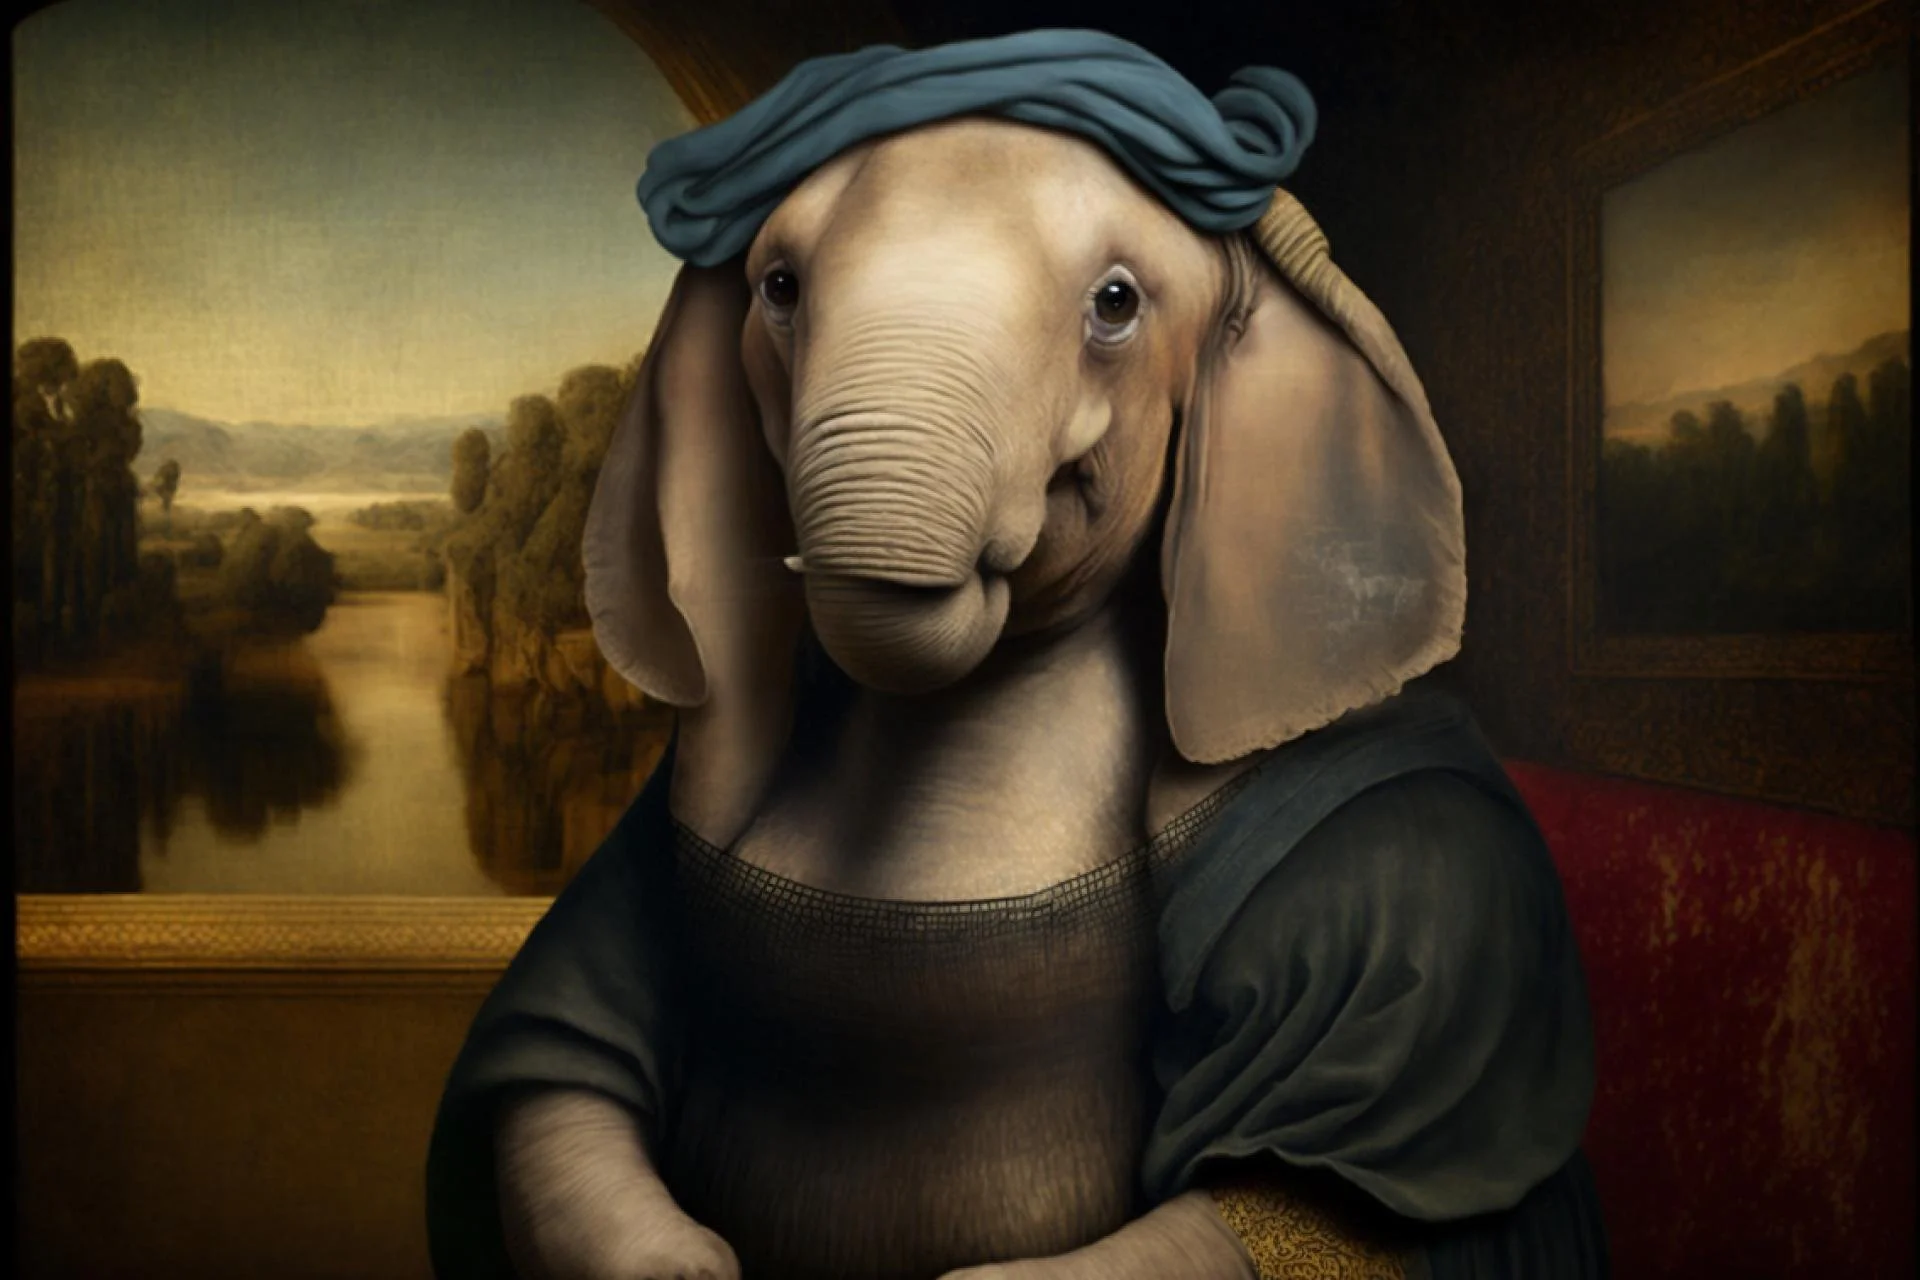
Photos from Wade Sisler/NASA (left) and TuftsNow (right). Curated by Hailey Foster (hf348@cornell.edu).
This shift reflects an understanding that interpretation is not purely computational. While algorithms process large volumes of information, human insight still depends on perception. Artistic practices emphasize visual structure, spatial relationships, and experimental engagement – approaches that can disclose connections that remain abstract in numerical form. In this context, art functions as a perceptual tool, restructuring how information is arranged so patterns become cognitively visible.
One approach to transform artistic interpretation involves institutional partnerships. NASA’s collaboration with the Maryland Institute College of Art allows art students to work directly with scientists, producing animations and visual representations based on real scientific research [2]. In these collaborations, artists translate actual scientific datasets into motion, color systems, and layered spatial compositions. By adjusting scale and mapping dimensions visually, and animating processes that evolve over time, they enable researchers to observe interactions that static graphics might conceal. The changes occur not in the data itself, but in how it is structured and experienced.
Artistic engagement with data is also visible in cultural and academic settings. The exhibition Seeing the Unseeable: Data, Design, Art at the Cantor Arts Center at Stanford University showcased artists who use large-scale datasets as creative material, transforming scientific information into visual and spatial forms [3]. By enlarging microscopic structures, mapping invisible networks, artists transform complex data sets into visual experiences. One example is Mimi Ọnụọha’s mixed-media installation The Library of Missing Datasets, which constructs a physical archive of datasets that do not exist, visualizing the absence of information and revealing how blank spaces within data-saturated systems reveal hidden cultural priorities and biases[4].
Similarly, a Harvard symposium on data, art, and algorithms highlighted collaborative projects that explore algorithmic systems through immersive installations [5]. By rendering algorithmic processes in spatial and experiential formats, these projects demonstrate how presentation shapes understanding. When algorithmic systems are translated into immersive environments, viewers can physically navigate representations of code-driven processes.
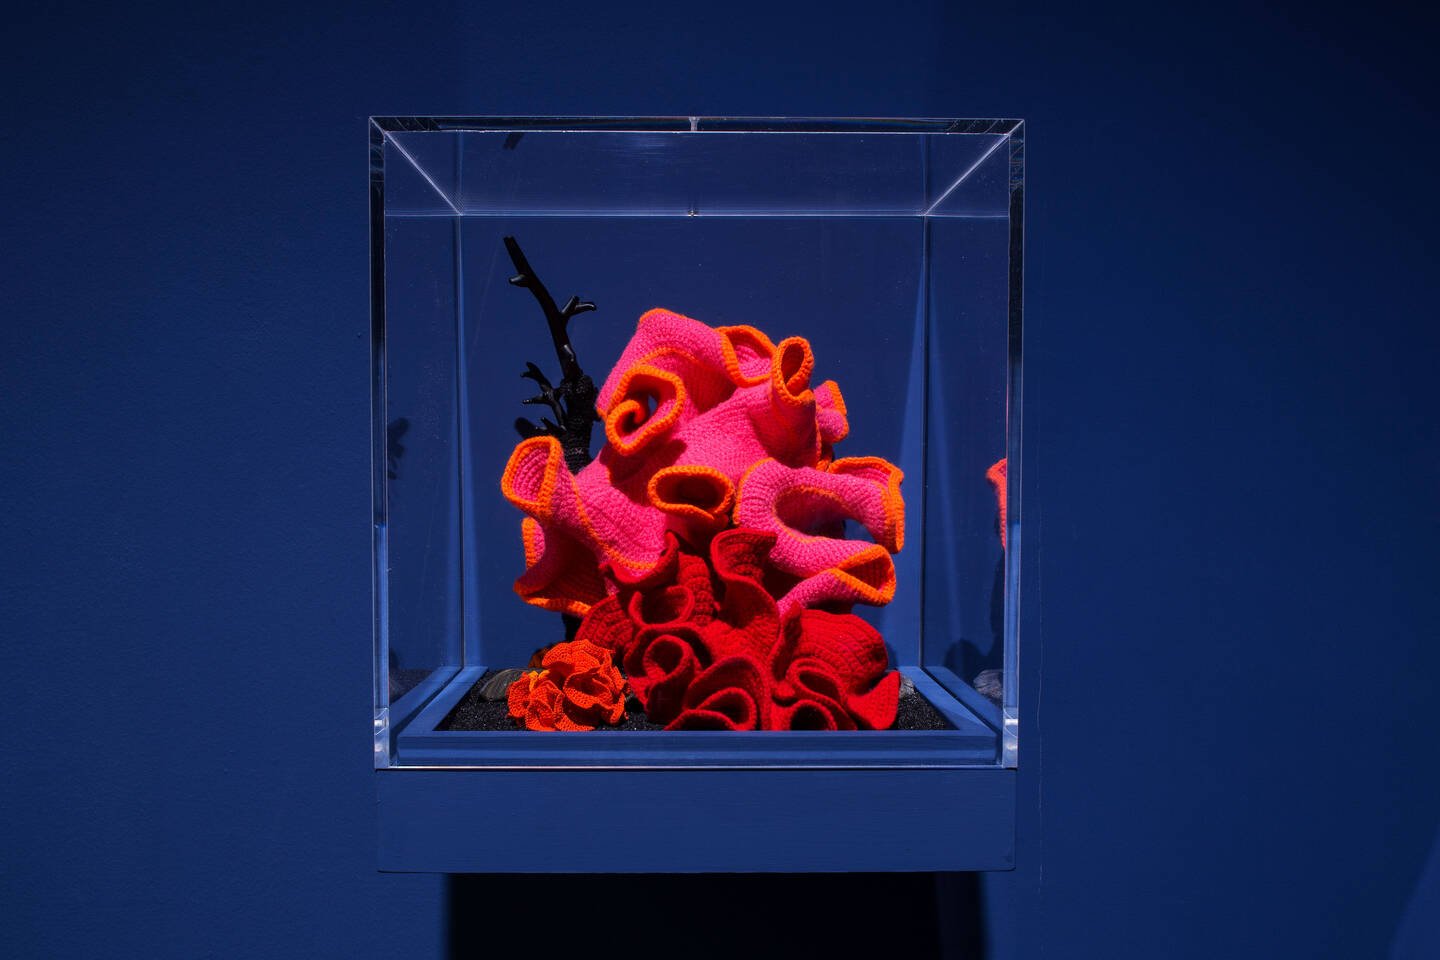
Photo from ArtCenter. Curated by Hailey Foster (hf348@cornell.edu).
Across these examples, art is not used merely for illustration. It functions as a method of exploration and interpretation. Artists collaborate directly with scientists, participate in tool development, and design interactive systems that shape how data is encountered. They alter scale, map dimensions to visual properties, design interfaces for exploration, and construct spatial narratives that reorganize complexity into perceptible form.
As scientific datasets continue to expand in scale and complexity, the ability to interpret them becomes increasingly important. The growing integration of artists into research environments suggests that understanding Big Data may require not only advanced computational methods, but also new perceptual strategies. In this evolving landscape, art is becoming not a supplement to science, but part of how science sees.
Gabby Coleman ’29 is in the College of Engineering. She can be reached at ggc38@cornell.edu.